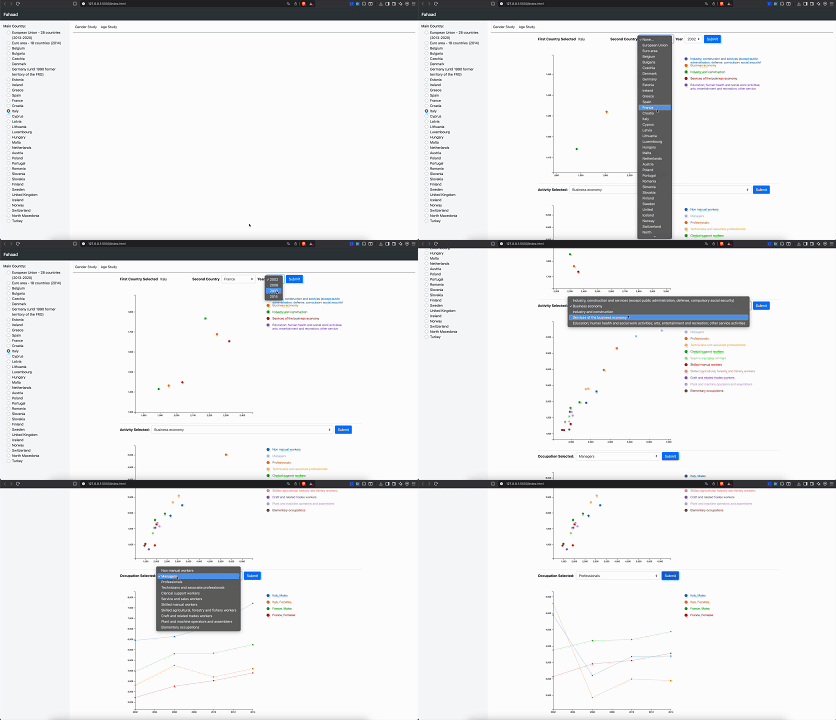
I built this as a university data-visualisation project. The app renders three coordinated views:
- Activities scatterplot — compares Males vs Females for each economic activity in a selected country and year.
- Occupations scatterplot — filters by a chosen activity and compares Males vs Females across occupations.
- Time series — shows how a selected occupation evolves for both genders across years.
Interactions. Pick a main country (radio list) and optionally a second one, switch year, activity and occupation. Hover any mark to reveal exact values; legends are colour-coded. Missing data is surfaced with small alerts rather than breaking the flow.
Stack. D3.js v4, Bootstrap 4, a pinch of jQuery, plain HTML/CSS/JS (no build step).

Source & quick start
- Source: GitHub repo
- Run locally: open
index.htmlvia a simple dev server:npx serve . # or VS Code "Live Server"